Understand your distribution ecosystem through data analytics
As a brand or as a distributor, understanding your distribution ecosystem is critical if you want to improve your sales efficiency, your competitiveness and monitor your marketing strategy. Distribution data analytics are key to the improved overall performance of your company.
Your challenges
Create indicators to extract relevant information to monitor your actions (brands)
Keep track of changing prices & checking on competitive prices for all your reference (distributor)
Analyse your product portfolio mix performance to beat your competition (distributor)
Lizeo®.Distribution Intelligence
Lizeo®.distribution intelligence delivers comprehensive data insights and reports about your distribution ecosystem through dashboards and key indicators gathered in a SAAS Business Intelligence solution. It enables in-depth analysis of the performances of your prices, products, marketing, and sales strategy within your distribution network.
For distributors and dealers, Lizeo®.distribution intelligence brings you detailed analytics about your competitor price behavior and their product mix to maximise the efficiency of your product category management and pricing strategy.
Indicators
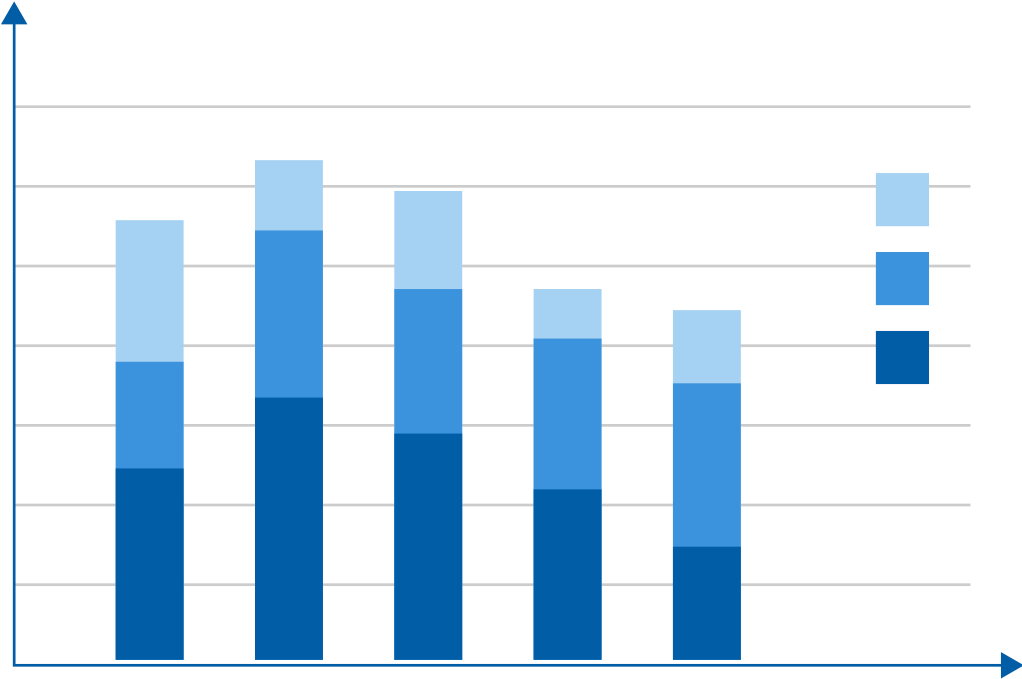
Product Offering Ratio
Assess and compare by websites and distribution network the number of products offered by brands, market segment, etc.
Analyse the exposure of your product offering to your final customer
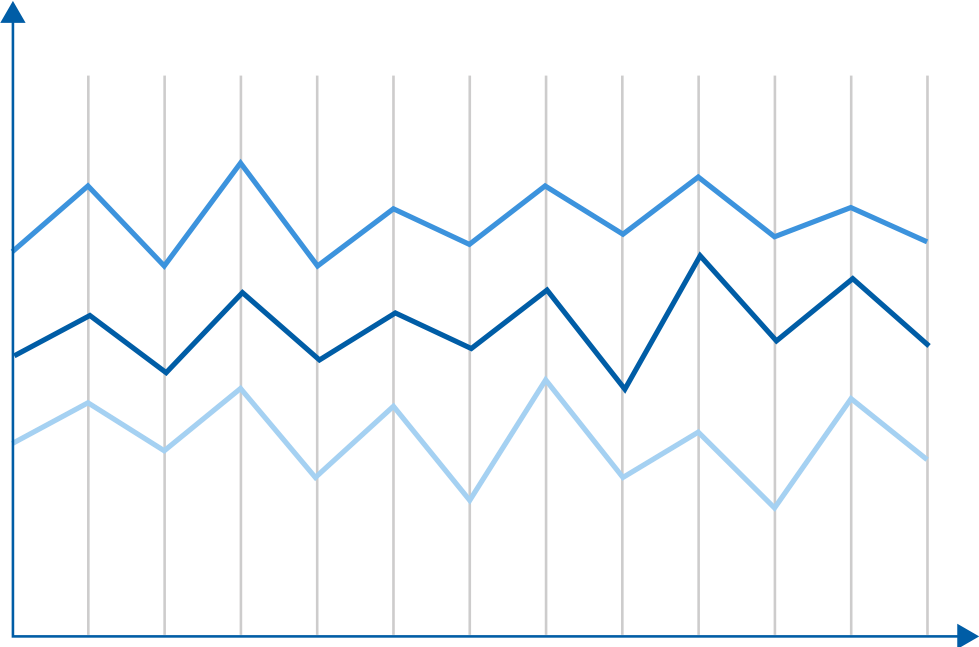
Visibility Evolution
Track the evolution of brand referencing by day thanks to the average number of price per day.
Monitor the evolution of the online visibility of product offering for multiple brands
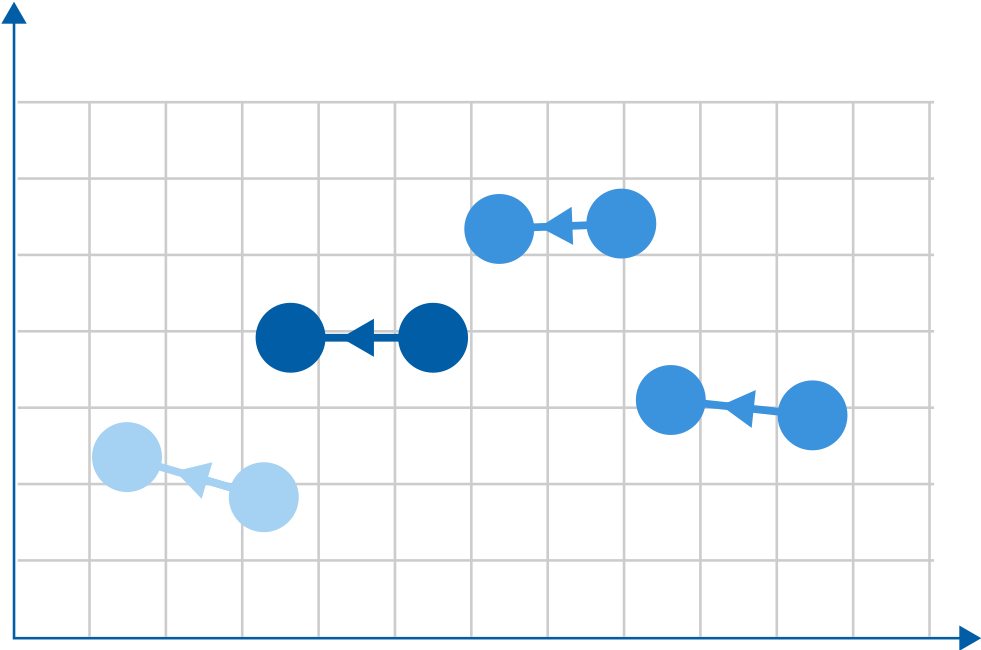
Loyalty Monitoring
Monitor your brand product loyalty for a given selection of distributors and websites.
Assess your marketing & sales campaigns efficiency towards your distribution ecosystem
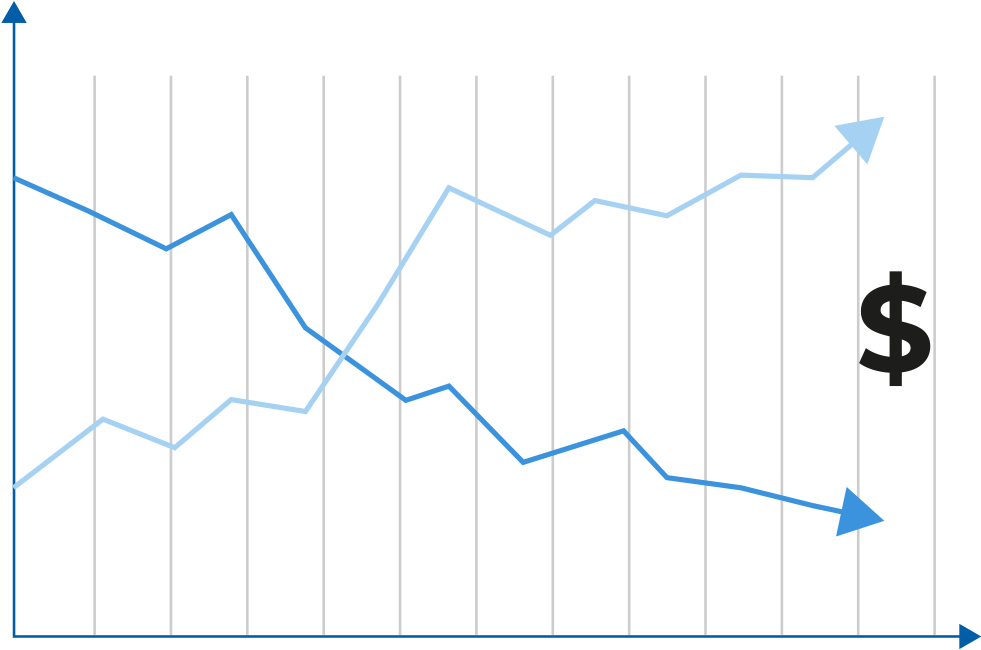
Repricing Analysis
Track distributors’ repricing strategies and dynamics: frequency of repricing, share and volume of repriced products, etc.
Anticipate your competitors by understanding their repricing strategies
Reporting & Insights
1. REPORTING
Identify long term price, marketing & sales strategies through a periodical overview of your market distribution ecosystem in a given time period and historical evolution.
2. INSIGHTS
Lizeo provides you with insights and recommendations based on in-depth data analysis and market knowledge. This consulting service is the first step towards the implementation of a strategy to leverage your distribution network to maximize your margins and competitiveness.
The benefits as a Brand
Analyse the presence & evolution of your product references in your distribution ecosystem
Compare easily your product distribution coverage to your competitors’
The benefits as a Distributor
Understand your competitors’ product referencing strategies
Spot opportunities for repricing & portfolio optimisation
Who is it for?
Marketing & Product Teams
Category Management Teams
Would you like more information? Would you like a demo?
Let's work together to find the best approach to meet your company's needs.