
3 Key Indicators to Analyze Price Positioning
As an analyst, you want to monitor and understand your market prices. The objective? Set the most appropriate price possible in a competitive market and as such, maximize revenue. In this context, perhaps you have already collected competitor prices. If this is the case, congratulations: it is the first essential step! But, do you have the ability to correctly analyze this data? Discover the price indicators to monitor in your Business Intelligence and reporting tools.
1/ Monitor your competitors’ pricing trends
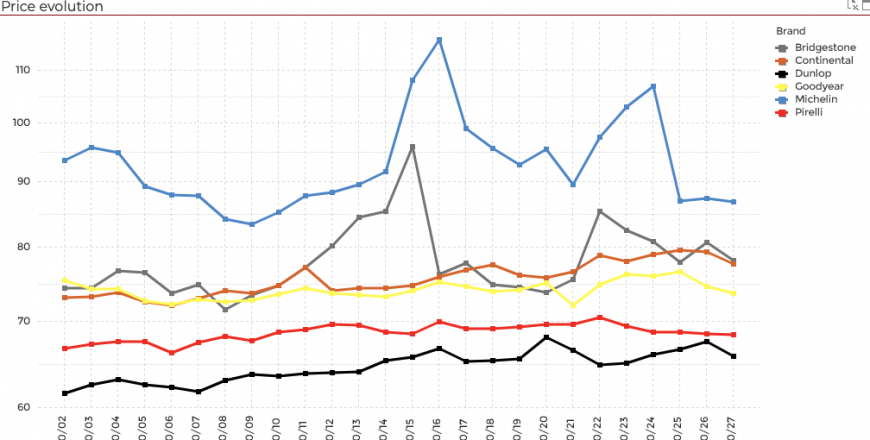
The analysis of competitors’ prices will allow you to better identify and understand the main trends in your market (promotions, seasonality, etc). By monitoring and comparing price changes over a given period you can determine what tactical decisions your competitors apply in response to these trends.
- Curves showing market price evolutions will allow you to monitor the min/max, average or median price variations at an aggregated level for a selection of brands, products, market segments or websites.
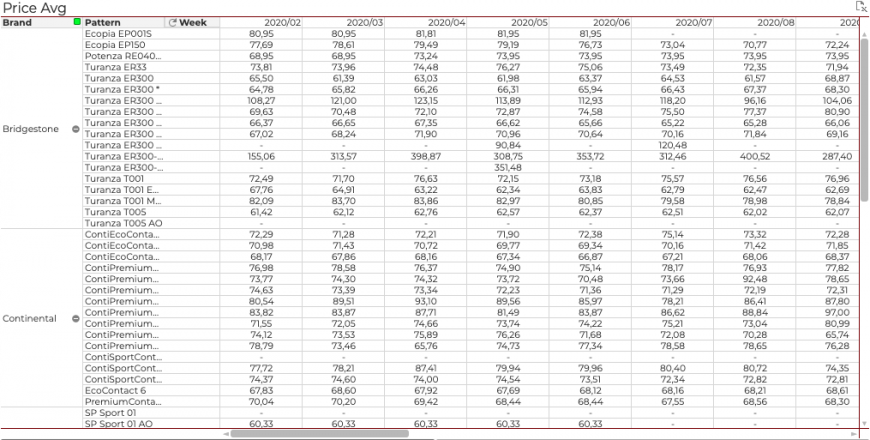
- The table giving price history details associates all of the data available on products in your market (EAN, sizes, etc.) with price data over the selected period. A relevant KPI, particularly in the analysis of past events (promotions, conditions, climatic, etc.).
2/ Price Index monitoring
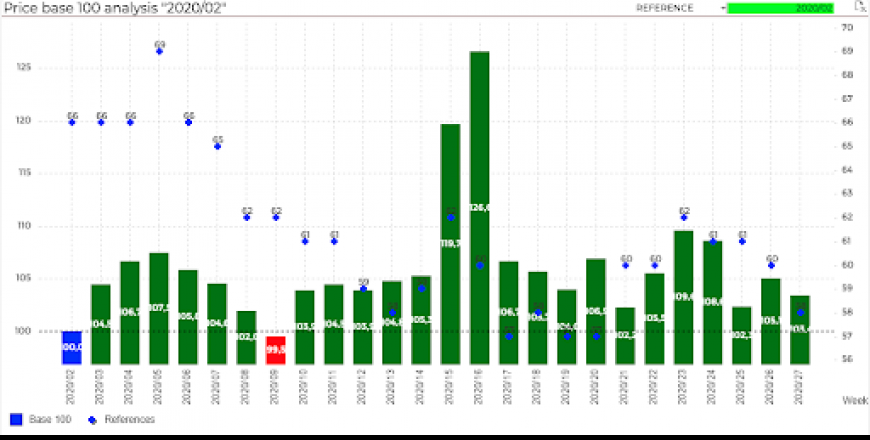
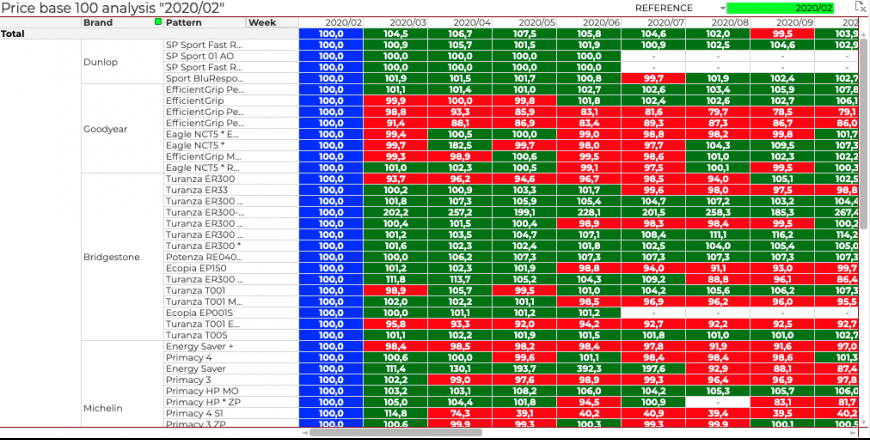
Building a price base 100 consists of taking the price of a brand’s product, a website or a date as a reference point. The price index is calculated on this base 100 and allows the price positioning of a brand to be compared with the reference, and this instantaneously, or over a given period of time. The method is used to neutralize the “product mix” effect of distributors.
Example: today, the price is defined as the reference (T0) – the following days will be compared with this T0. If the index is below 100, then the price has dropped.
3/ Understanding your price positioning
Your price positioning reflects your brand image. Over time, it is important to understand your place in the market.
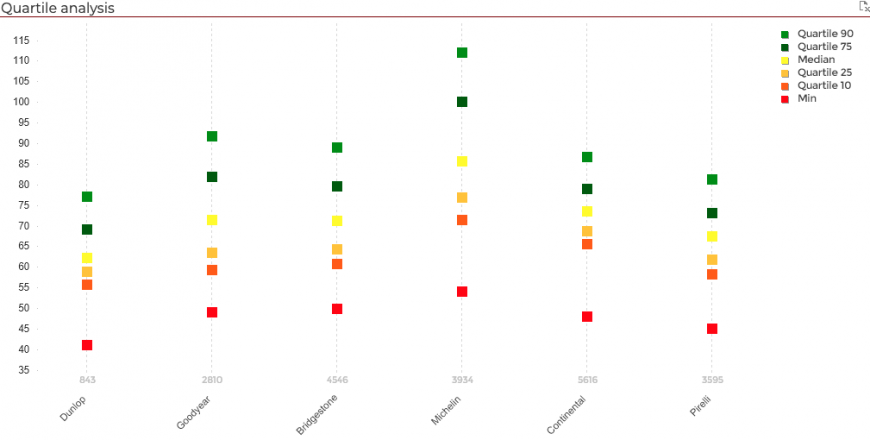
The aggregate view of quartiles will allow you to understand the spread of market prices and, at a glance, identify the relevant corridors in which your references can be positioned.
The depositioning table is used to identify players with very competitive prices (knock-down promotional prices), or on the contrary, high prices due to lack of stock, for example.
Alerting for an efficient pricing strategy
An automated and qualitative price monitoring approach is crucial when implementing your pricing strategy. Have you considered implementing an alerting system to keep informed about any major changes or drops in competitors’ prices in real time?
Through the configuration of trigger thresholds for a defined scope, you will be alerted on a daily or weekly basis of any points requiring attention and other strong market signals (huge discounts, launch of competitor’s products, margin opportunity, etc.).
Depending on previously defined business rules, this real time view will allow you to automatically detect pricing anomalies which require an immediate pricing action.
Competitive pricing data helps analyze the market and ultimately, will help you adapt your pricing strategy, the cornerstone of the marketing strategy. To build the most appropriate strategy possible, you must cross it with other data flows (sales volume, consumer perception, brand reputation, etc.). As an expert in the analysis of market data, Lizeo can help you analyze pricing data. Would you like to discover these key indicators through a demonstration?